
Definition
The mean in Excel refers to the average value of a set of numbers, calculated by summing all values and dividing by the total count. Excel provides built-in functions likeAVERAGEto quickly compute the mean, making data analysis faster and more accurate.
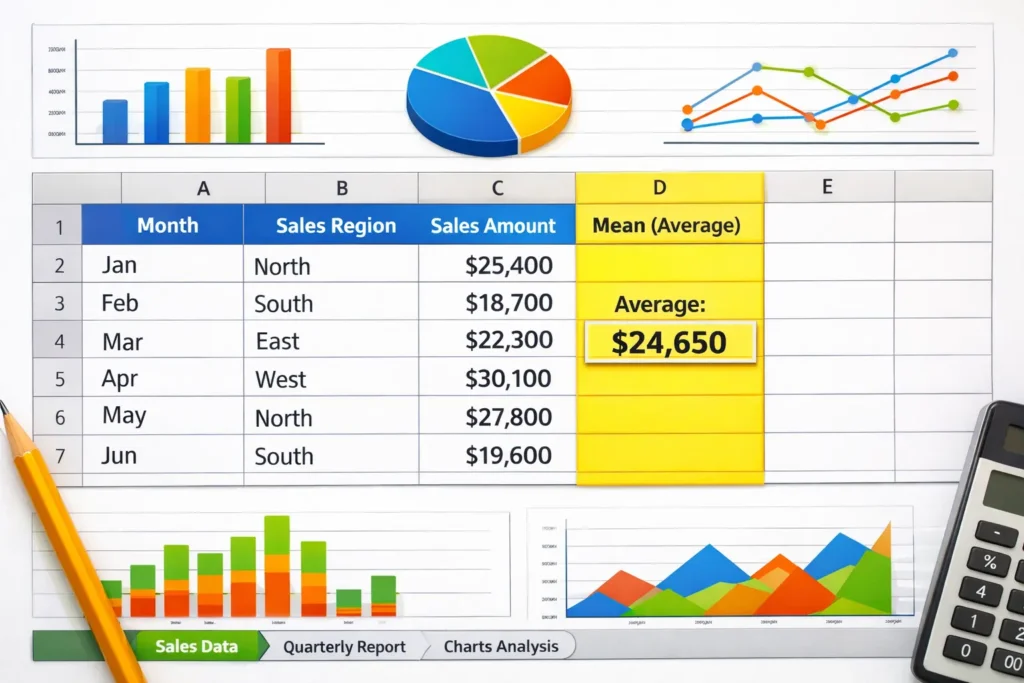
Excel is more than just a spreadsheet tool it’s a powerful calculator, database, and reporting software all in one. One of the most commonly used statistical concepts in Excel is the mean, or average. You’re tracking sales figures, analyzing survey results, or monitoring student grades, calculating the mean helps you summarize large amounts of data into a single, easy-to-understand number.
For beginners and professionals alike, knowing how to do mean in Excel saves time, reduces errors, and improves insights. In this guide, we’ll cover everything you need from the basics to practical examples, comparisons with related terms, and FAQs so you can confidently calculate averages in any dataset.
Origin of the Mean Concept in Excel
The concept of the mean originates from statistics, where it’s one of the primary measures of central tendency alongside median and mode. The mean helps describe a “typical” value in a dataset.
Excel incorporated this function early on as part of its statistical toolkit, making it accessible to millions of users worldwide. The AVERAGE function became popular because of its simplicity and efficiency, replacing manual calculations and improving accuracy.
Today, Excel users across industries from business analysts to teachers rely on the mean to quickly make sense of their numbers.
How to Do Mean in Excel: Step-by-Step Methods
Excel provides multiple ways to calculate the mean. Here’s a friendly guide to each method:
1. Using the AVERAGE Function (Most Common)
The simplest way to calculate the mean:
Syntax:
=AVERAGE(number1, number2, ...)
Example:
Suppose you have test scores in cells A1 to A5: 85, 90, 78, 92, 88.
=AVERAGE(A1:A5)
Result: 86.6 ✅
This automatically sums the numbers and divides by the count.
2. Using SUM and COUNT Functions
For a more manual approach:
Formula:
=SUM(A1:A5)/COUNT(A1:A5)
Explanation:
SUM(A1:A5)adds all the numbers.COUNT(A1:A5)counts how many numbers are present.- Dividing gives the mean.
This method is helpful if you want more control or need to adjust the calculation for non-numeric data.
3. Using Quick Analysis Tool
Excel’s Quick Analysis tool (available in newer versions) can automatically calculate averages:
- Highlight your data.
- Click the Quick Analysis icon.
- Choose Totals → Average.
Instant mean calculation without typing formulas! 🌟
4. Using Pivot Tables for Grouped Mean
When dealing with large datasets:
- Select your dataset.
- Go to Insert → PivotTable.
- Drag your data field into the Values area.
- Set the Value Field Settings → Average.
Perfect for analyzing mean values across categories (e.g., average sales per region).
Example Table: Calculating Mean in Excel
| Student | Score | Formula Example | Mean Result |
|---|---|---|---|
| John | 85 | =AVERAGE(B2:B6) | 86.6 |
| Lisa | 90 | ||
| Mark | 78 | ||
| Sarah | 92 | ||
| Emma | 88 |
This shows how Excel simplifies statistical calculations, even for beginners.
Real-World Usage of Mean in Excel
The mean is versatile and widely used:
- Business: Track average sales, revenue, or expenses.
- Education: Calculate average grades or test scores.
- Finance: Analyze average returns or monthly expenses.
- Research: Summarize survey or experimental data.
💡 Tip: Always check for outliers before calculating the mean, as extreme values can skew the results.
Comparing Mean with Related Terms
| Term | Definition | Difference from Mean |
|---|---|---|
| Median | Middle value when data is sorted | Median is less affected by outliers. |
| Mode | Most frequently occurring value | Mode identifies frequency, not central tendency. |
| Weighted Mean | Average considering weights | Weighted mean is used when some values contribute more. |
Knowing these differences ensures accurate statistical interpretation.
Alternate Mean Interpretations
While “mean” usually refers to the arithmetic average in Excel:
- Polite/Professional Use: “Average” is generally preferred in reports or presentations.
- Other Contexts: “Mean” can also imply “intention” or “significance” in English, but in Excel and statistics, it strictly refers to the numerical average.
Tips for Calculating Mean in Excel Like a Pro
- Use named ranges for clarity:
=AVERAGE(TestScores)instead ofA1:A10. - Combine with conditional formulas like
AVERAGEIForAVERAGEIFSfor filtered data. - Avoid empty or text cells;
AVERAGEignores them, but formulas likeSUM/COUNTmay need adjustments. - Format results to show decimal places if precision matters: Home → Number → Increase Decimal.
- Double-check for outliers that could skew your mean.
FAQs
1. How do I calculate the mean of a column in Excel?
Simply use =AVERAGE(ColumnRange), e.g., =AVERAGE(B2:B20).
2. Can I calculate the mean of non-contiguous cells?
Yes! Use commas: =AVERAGE(B2,B5,B7).
3. What is the difference between mean and median in Excel?
Mean averages all numbers, while median shows the middle value, less affected by outliers.
4. How do I calculate a weighted mean in Excel?
Use =SUMPRODUCT(values, weights)/SUM(weights) for weighted averages.
5. Does Excel ignore empty cells in mean calculation?
Yes, the AVERAGE function automatically ignores blank cells and text values.
6. How do I find the mean using a Pivot Table?
Drag your data into Values and select Value Field Settings → Average.
7. Can I calculate the mean conditionally?
Yes, use =AVERAGEIF(range, criteria) or =AVERAGEIFS(range, criteria1, criteria2, …).
8. Why is my mean calculation wrong?
Check for non-numeric data, hidden cells, or extra spaces these can affect manual formulas like SUM/COUNT.
Conclusion
Learning how to calculate the mean in Excel is a foundational skill for data analysis. Whether you use the AVERAGE function, a combination of SUM and COUNT, PivotTables, or conditional formulas, the mean allows you to summarize data clearly and efficiently.
When working with your data, it’s important to choose the method best suited to your dataset’s size and complexity. Additionally, if your data contains outliers, considering the median or mode might provide more accurate insights.
With these strategies, calculating averages in Excel becomes fast, accurate, and insightful perfect for school, work, or personal finance. 📊✨
Discover More Related Articles:
- i-Ready Level C Explained: What It Means & Why It Matters In 2026
- iReady Level G Explained: What It Means & Why It Matters in 2026

David Brown is a content writer and language enthusiast at textroast.com, where he creates insightful articles that explain the meanings of words, slang, and phrases used in everyday life. His work helps readers decode modern language trends, understand cultural expressions, and make sense of online communication with clarity and fun.